Antalya Property Market: September 2026 Review
10 November 2026 Şeref Karaca, Real Estate Consultant
Every month we bring together and interpret the official data for anyone buying, selling or letting a home in Antalya. In this first issue we look at the latest figures released as of September 2026: the house price index, the sales price per square metre, rent per square metre and the number of sales. You can always find the latest figures on our Antalya property market page as well.
This month in brief
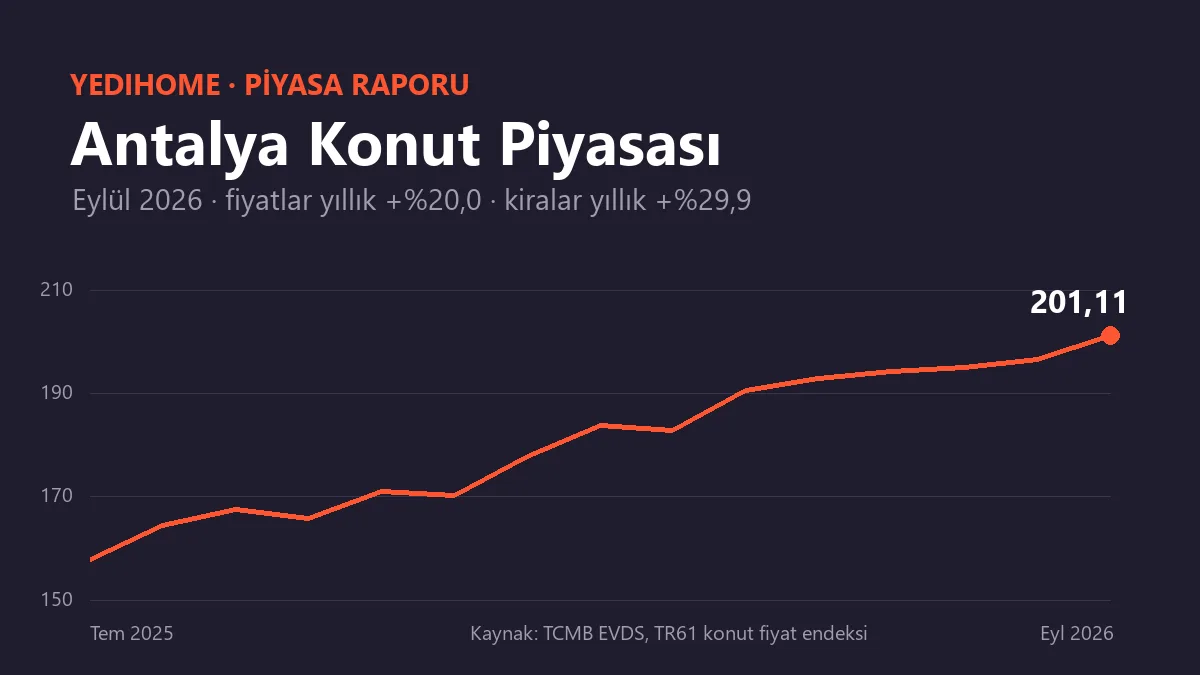
- Prices: In the Antalya region (TR61: Antalya, Isparta, Burdur), house prices rose by 20.0% in one year. The increase across Türkiye was 22.3%.
- Price per square metre: The average sales price of housing in Antalya in Q3 2026 was 59,438 TL per square metre, about 10% above the Türkiye average.
- Rents: Rent per square metre in Antalya rose by about 30% in one year, faster than prices.
- Sales: 6,704 homes were sold in Antalya in September 2026, about 15% more than in August.
The Antalya housing market in numbers
| Indicator | Latest value | A year earlier | Change |
|---|---|---|---|
| House price index, TR61 (September) | 201.11 | 167.58 | +20.0% |
| House price index, Türkiye (September) | 239.38 | 195.66 | +22.3% |
| Sales price per m², Antalya (Q3) | 59,438 TL | 48,204 TL | +23.3% |
| Sales price per m², Türkiye (Q3) | 53,887 TL | 42,549 TL | +26.6% |
| Rent per m², Antalya (Q3) | 282.65 TL | 217.55 TL | +29.9% |
| Home sales, Antalya (September) | 6,704 | – | +14.5% vs August |
Prices: still rising, but behind inflation
According to the House Price Index of the Central Bank of the Republic of Türkiye (CBRT), prices in the TR61 region, which includes Antalya, rose by 2.3% in September compared with the previous month. At 20.0%, the annual increase was slightly below the Türkiye average (22.3%). The CBRT's September bulletin notes that, adjusted for inflation, house prices across Türkiye fell by about 5.7% over the year. In other words, despite the nominal increase, housing has become cheaper in terms of purchasing power over the past year.
The price per square metre in Antalya, meanwhile, remains above the Türkiye average. In the third quarter, the Antalya average was 59,438 TL and the Türkiye average was 53,887 TL. This gap can be explained by Antalya's coastal location and the structure of demand; however, prices at district and neighbourhood level differ markedly from this average.
Rents: rising faster than prices
Rent per square metre in Antalya climbed from 217.55 TL to 282.65 TL in one year, an increase of about 30%. The rise in the last quarter alone was around 7%. Rents rising faster than prices increases the gross yield on homes bought to let: a rough calculation based on the average rent and sales price per square metre shows the annual gross rental yield rising from about 5.4% a year earlier to 5.7%. This calculation does not include service charges, taxes or vacant periods.
Sales and foreign buyers
According to TurkStat data, 6,704 homes were sold in Antalya in September 2026; 2,271 of these were first-hand, i.e. sales by developers. Across Türkiye, sales in September fell by 9.3% compared with a year earlier. In sales to foreigners, Antalya ranked second after Istanbul in August with 599 homes. In September, the foreigners buying the most homes in Antalya were citizens of Russia (260), Ukraine (108) and Germany (69).
What does this mean for buyers, sellers and landlords?
- For buyers: Prices are rising in nominal terms but falling in real terms. Room for negotiation varies by property and neighbourhood; do not decide without seeing comparable sales. See your purchase costs in advance with our calculator.
- For sellers: Sales picked up at the end of the summer. Correctly priced properties find buyers more quickly; it is important to set the price based on comparables in the property's own neighbourhood, not on average data.
- For landlords: Although rents are rising fast, the annual increase in residential rents is legally capped at the twelve-month average CPI of the previous year. In new contracts, rent is set according to market conditions.
About the data
The price index, sales price per square metre and rent per square metre are taken from the CBRT's EVDS system; the number of sales and sales to foreigners are taken from TurkStat's Housing and Commercial Property Sales Statistics. The CBRT and TurkStat are data providers only; the commentary belongs to Yedihome. Index and per-square-metre values are provincial or regional averages; they do not show the value of any individual property. To find out the current value of your property, you can submit a valuation request.
Would you like to talk to a consultant about this?
Send us your questions and we will reply based on the current situation in Antalya.